Experiment

New York City sea level map: how far would the water reach?

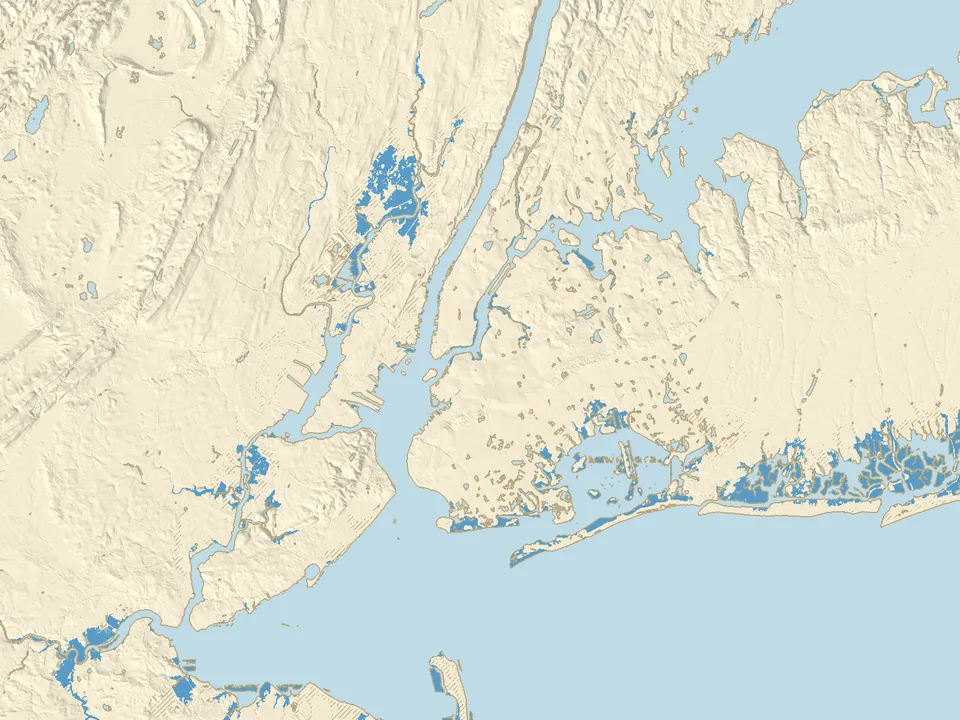
Move the slider from −10 to +10 m and see how far the sea would reach in New York City, New Jersey and Long Island. One of the buttons shows the level the water reached at The Battery during Hurricane Sandy in 2012.

Loading elevation data…
+2.0 mabove today
Raise
Lower
  • water
  • new water
  • below sea level, behind embankments and levees
  • exposed seabed
145 km²56 sq miof land under new water in the map area
89.3 km²34 sq milies below sea level but is cut off from it by embankments, levees and dikes

Half of the land within 500 m

When would the sea reach Manhattan, Hoboken and the airports?

  • Coney Islandtypical height of the area +1.8 m, water covers half of it from +1.8 mflooded
  • Hobokentypical height of the area +2.0 m, water covers half of it from +2.3 mdry
  • LaGuardia Airporttypical height of the area +2.6 m, water covers half of it from +2.6 mdry
  • JFK Airporttypical height of the area +3.3 m, water covers half of it from +3.3 mdry
  • Lower Manhattantypical height of the area +3.3 m, water covers half of it from +3.6 mdry
  • Midtown Manhattantypical height of the area +16.4 m, water covers half of it from +16.6 mdry

Data: USGS 3D Elevation Program, NOAA, GEBCO 2026. Sources and changes

Is New York below sea level?

New York, the largest city of the United States, lies where the Hudson River meets the Atlantic. The map covers 80 by 60 km: the five boroughs, part of New Jersey and western Long Island, on the USGS elevation model (3D Elevation Program).

Only 20.9 km² (8 square miles) below zero

In the map area only 20.9 km² (8 square miles) of land lies below today's mean sea level, less than 1% of the land on the map, in small scattered spots. New York does not lie in a depression like Amsterdam: the typical height of the area around Lower Manhattan is about +3.3 m, and of Midtown about +16.4 m. The lowest ground is along the bays, the marshes and the beaches, such as Coney Island, where the typical height is about +1.8 m.

American heights are given relative to NAVD88. We convert them to mean sea level as measured by NOAA at The Battery station at the southern tip of Manhattan (1983 to 2001): there, 0 m NAVD88 lies 6 cm above mean sea level.

At +1 m and +2 m: bay shores, marshes and beaches

At +1 m the water covers 59.7 km² (23 square miles) of land, mostly marshes and bay shores. At +2 m it is 145 km² (56 square miles). Half of the area around Coney Island floods from +1.8 m, Hoboken from +2.3 m, the Meadowlands in New Jersey from +2.5 m and LaGuardia Airport from +2.6 m.

The hatched ground at +2 m covers 89.3 km² (34 square miles): it lies lower than the sea, but in the data a higher strip of ground separates it from the water, such as a road or rail embankment, a levee or a dike.

+3.5 m: about as high as Sandy in 2012

On 29 October 2012 Hurricane Sandy raised the water at The Battery to 4.28 m above mean lower low water (NOAA), about +3.5 m above mean sea level. At that level 431 km² (170 square miles) of the map is under water. Half of the area around Red Hook floods from +3.1 m, JFK Airport from +3.3 m and Lower Manhattan from +3.6 m.

This is not a replay of Sandy: the storm surge lasted a few hours and its height differed from place to place, while the map shows a steady level, the same everywhere. It does show which neighbourhoods lie at a height the water has already reached once.

Why some low ground is hatched

Hatched ground lies below the chosen level, but in the data a higher strip of ground separates it from the sea. The model does not know the culverts, pipes and tide gates under the embankments, so in reality the water may get there sooner. A 10 m grid does not show floodwalls accurately, and some of those built after Sandy may not be in the data yet.

How to read the sea level map of New York

The colours on the map

  • Blue: new water. The sea reaches it at the chosen level over today's ground.
  • Hatched: the land lies below the chosen sea level, but in the data embankments, levees and dikes cut it off from the water.
  • Beige and grey: the seabed that is exposed when the sea draws back.
  • Light blue: the water that is there today: the Atlantic, the Hudson, the East River, the bays and the lakes.
  • Thin brown line: today's shore, which stays on the map at every level.

What this experiment shows, and what it does not

Assumptions

  • The level on the slider is the mean sea level, the same everywhere. At The Battery the mean higher high water (MHHW) lies 0.76 m higher (NOAA), and storms push the water higher still. The NOAA and Climate Central maps count the rise from MHHW, so at the same "+1 m" they show more water than ours.
  • Embankments, levees and dikes keep today's height and do not break. When water spills over one, the ground behind it floods on the map at once.
  • The map does not count rain, river floods or the sewers through which the sea can back up into the city.
  • This is not a forecast for a given year and not a risk assessment for a particular house or plot. The FEMA and city flood zones describe something else: the risk of flooding in storms.

The data and its accuracy

Land elevation comes from the USGS 3D Elevation Program model at 1/3 arc-second (about 10 m): ground without buildings or trees. The model shows rivers and bays as a flat water surface, and where it holds the bottom instead, we tell it from land because the sea covers it already at +0.1 m. Treat the flooding levels as approximate.

The sea floor comes from the GEBCO grid (cells of about 450 m), so at negative levels the shore is less accurate than on land.
Questions about New York and sea level

Will New York be underwater?

It depends on how far the sea rises. The IPCC (2023) projects a rise in mean sea level by 2100 of 0.28 to 1.01 m. On our map, at +1 m the water covers 59.7 km² (23 square miles) of land, mostly marshes and bay shores, while Midtown Manhattan typically lies about +16.4 m. With a higher sea, storms such as Sandy in 2012 also reach further.

What year will New York be underwater?

We do not give a date: the map shows sea levels in metres, not years. The timing depends on how fast sea level rises and on how the city defends itself. On our map 145 km² (56 square miles) of land is under water at +2 m, and 431 km² (170 square miles) at +3.5 m, about as high as Sandy at The Battery.

Is Lower Manhattan below sea level?

No. The typical height of the area within 500 m of Battery Park is about +3.3 m above mean sea level, and half of that area floods on the map from +3.6 m. During Sandy the water at The Battery reached about +3.5 m above mean sea level, higher than the typical height of that area.

What is the elevation of New York City?

It varies. The typical height of the area around Midtown Manhattan is about +16.4 m, Lower Manhattan about +3.3 m, Hoboken about +2.0 m and Coney Island about +1.8 m above mean sea level. In the whole map area less than 1% of the land lies below sea level.

How high did the water rise during Hurricane Sandy?

At The Battery in Manhattan, on 29 October 2012, the water reached 4.28 m above mean lower low water (NOAA), about +3.5 m above mean sea level. The +3.5 m button shows that level on the map, but steady and the same everywhere, not the course of the storm.

Where does the data on this map come from?

Land elevation comes from the USGS 3D Elevation Program model (public domain), mean sea level from NOAA measurements at The Battery station, and the sea floor from the GEBCO 2026 grid. Our own calculation shows which places the water reaches over today's ground. The data methodology page describes the sources and our changes.