How high above sea level is Miami?
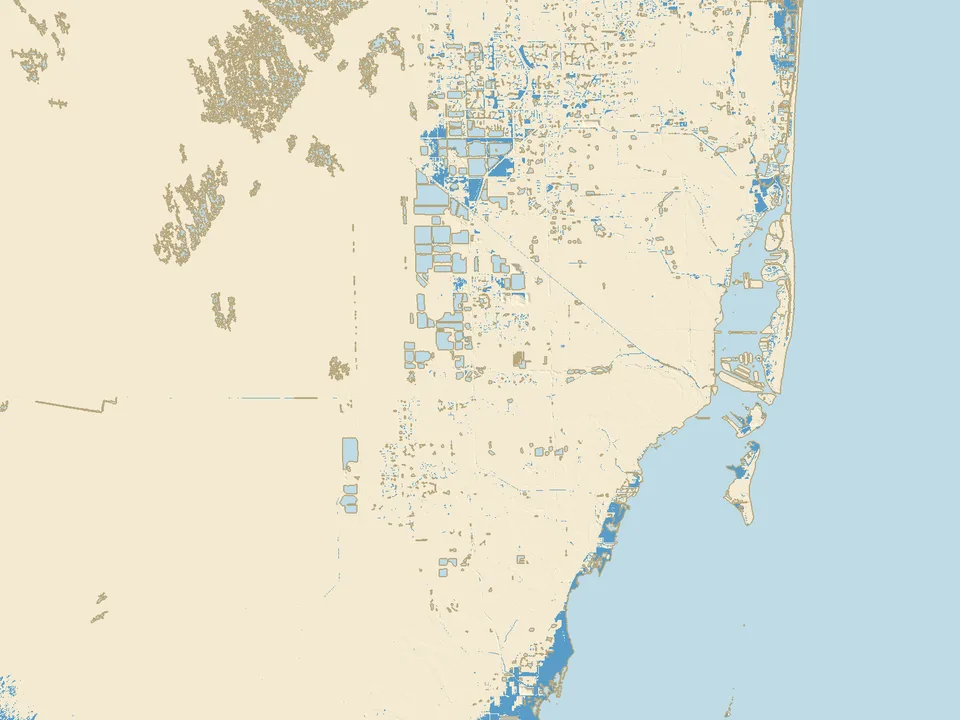
Miami lies in the southeast of Florida in the United States, between the Atlantic and the Everglades. The map covers 80 by 60 km: Miami, Miami Beach, Hialeah, southern Broward County and the eastern edge of the Everglades, on the USGS elevation model (3D Elevation Program).
Nothing below zero, but almost everything low
In the map area no land lies below today's mean sea level, but the ground is very flat. The typical height of the area around Miami Beach is about +1.4 m, Key Biscayne about +1.5 m, Downtown Miami about +2.8 m and the Everglades about +2.0 m. In New York, for comparison, Midtown Manhattan lies more than ten metres above the sea.
American heights are given relative to NAVD88. We convert them to mean sea level as measured by NOAA at the Virginia Key station in Biscayne Bay (1983 to 2001): there, 0 m NAVD88 lies 27 cm above mean sea level.
From +1.0 m to +3.0 m: almost the whole map under water
At +1 m the water covers 124 km² (48 square miles), 4% of the land on the map: the shores of Biscayne Bay, the islands and the canal banks. At +2 m it is 1,231 km² (480 square miles), 37% of the land, and at +3 m 2,959 km² (1,140 square miles), or 89%.
It goes so fast because the Everglades and most neighbourhoods inland lie about 1.5 to 3 m above the sea: half of the area around Hialeah floods from +2.2 m, Miami International Airport from +2.4 m and Downtown from +2.8 m.
Why this map shows no protected land
Miami stands on limestone and carbonate sand that water flows through very easily: the USGS describes the Biscayne aquifer as highly permeable karstic limestone (2022). As the sea rises, its water pushes into the ground from the coast and from the canals.
So the map does not treat the low ridge along the coast as a levee: land floods once the sea reaches its height, even where water on the surface would have to cross higher ground. This is our assumption, a simplification of the water in the ground. Our other maps, the Netherlands for example, show the land behind the dykes as protected.
What this experiment shows, and what it does not
Assumptions
- The level on the slider is the mean sea level, the same everywhere. At Virginia Key the mean higher high water (MHHW) lies 0.34 m higher (NOAA), and hurricanes push the water higher still. The NOAA and Climate Central maps count the rise from MHHW, so at the same "+1 m" they show more water than ours.
- Land floods once the sea reaches its height, because the water passes through the limestone. The map does not count groundwater, rain or the work of the gates and pumps on the canals.
- This is not a forecast for a given year and not a risk assessment for a particular house or plot. The FEMA flood zones describe something else: the risk of flooding in storms and downpours.
The data and its accuracy
Land elevation comes from the USGS 3D Elevation Program model at 1/3 arc-second (about 10 m): ground without buildings or trees. The model shows water as a flat surface, and part of Biscayne Bay with its bottom, which we join to the rest of the bay. Treat the flooding levels as approximate.
The sea floor comes from the GEBCO grid (cells of about 450 m), so at negative levels the shore is less accurate than on land.