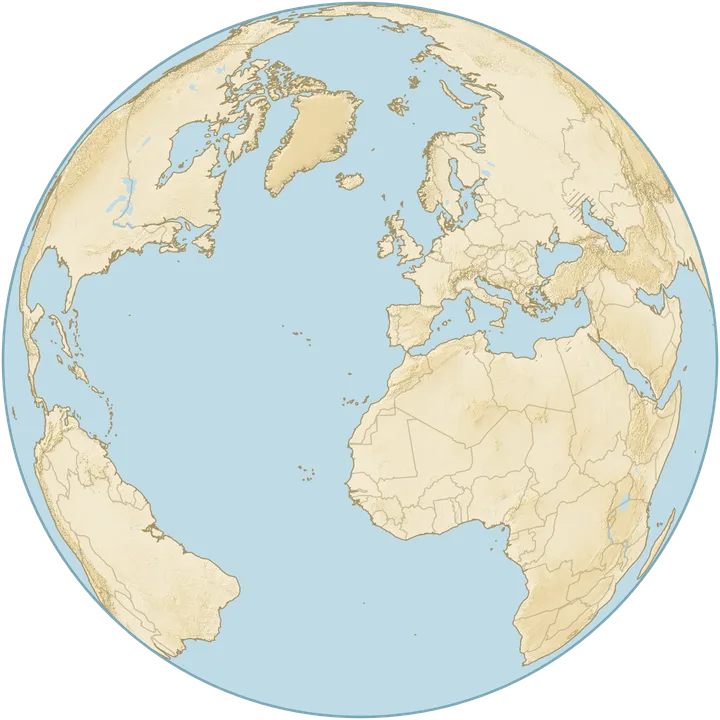
Move the slider to see how rising or falling sea levels change the world map. Explore what would happen if all the ice melted, or reveal the ocean floor. The experiment ranges from the sea floor to +5,000 m.
Loading elevation data…
today's mean sea level
ocean floor0 m+5,000 m
Raise
Lower
water
new water
exposed seabed
70.9%of Earth is covered by water today: oceans, seas and the largest lakes
646,000 km²249,000 sq miof land lies below sea level but the sea cannot reach it (hatched)
Share of each country's land under water
United States
United Kingdom
Australia
South Africa
Poland
Netherlands
Denmark
Bangladesh
Data: GEBCO Bathymetric Compilation Group 2026, The GEBCO_2026 Grid (doi:10.5285/4f68d5c7-45eb-f999-e063-7086abc036fa), public domain. Lakes, borders and coast: Natural Earth (public domain). Modified: averaged to 2′ and 8′ grids, water extent calculated.
What would happen if all the ice melted?
Melting all the glaciers and ice sheets would raise sea level by about 66 m. Use the globe to explore how this would change today's coastlines around the world.
+66 m: the world if all the ice melted
Greenland 7.42 m, Antarctica 57.9 m and mountain glaciers 0.32 m add up to about 66 m. In our data the water then covers 14.8 million km² (5.7 million square miles) of land, or 10%, and 73.8% of Earth instead of 70.9%. The Netherlands loses 98% of its land, Denmark 91%, Bangladesh 92%, the United Kingdom 28% and Poland 8.9%.
In our data the ocean reaches the Caspian Sea at about +32 m. The ice sheets are drawn as they look today: without the ice their surface would lie much lower, and the land beneath would rise over thousands of years.
Other sea level rise scenarios: from +1 to +5,000 m
Choose a level in metres and watch the coastlines move. The highest slider settings are extreme experiments that reveal the shape of the land. The map does not assign dates to them.
+1 m: projections for the end of this century
The IPCC (2023) projects a rise by 2100 of 0.28 to 0.55 m with the lowest emissions and 0.63 to 1.01 m with the highest, measured from the 1995 to 2014 average. On a whole globe a metre is smaller than a pixel, so this level will only show once we add close-ups of the coasts.
A metre still matters: in the tropics, 649,000 km² (251,000 square miles) of land lies less than 2 m above sea level, 62% of all such land worldwide (Hooijer and Vernimmen 2021).
+7.4 m: if Greenland melted
The whole Greenland ice sheet holds 7.42 m of sea level (BedMachine, 2017). On the globe the first changes show in the Netherlands, in Denmark and in the great river deltas. We will calculate areas for a few metres from more detailed coastal data: global data also measures treetops and roofs, so it understates flooding.
+100 m: an extreme case
At +100 m, 21.9 million km² (8.4 million square miles) of today's land is under water, or 15%, and water covers 75.2% of Earth. There is not enough ice on Earth for this level; it shows the shape of the lowlands, for example 24% of Poland's land.
From +100 to +5,000 m: when the continents disappear
Half of today's land would be under water at about +430 m; water would then cover about 85% of Earth. The continents lose half their area in this order: Europe (+170 m), Australia with New Guinea (+250 m), South America (+260 m), North America (+460 m), Asia (+500 m) and Africa (+500 m).
At +5,000 m only 745,000 km² (288,000 square miles) of land stays dry (0.5%), almost all of it on the Tibetan Plateau and in the Himalayas, with the rest in the Andes. Antarctica is drawn with its ice sheet as it is today, so half of its area goes under only at about +2,370 m.
How much land would different countries lose to sea level rise?
The table gives the share of each country's land that would be under water if the sea rose by the same amount everywhere and there were no dykes or pumps.
Share of land under water at different sea levels
Share of each country's land under water
Country
+10 m
+20 m
+66 m
+100 m
+1,000 m
United States
2.3%
4.1%
9.8%
14%
71%
United Kingdom
4.4%
8.8%
28%
44%
100%
Australia
1.3%
2.6%
7.6%
18%
99%
South Africa
0.1%
0.3%
1.3%
2.5%
42%
Poland
1.5%
2.2%
8.9%
24%
100%
Netherlands
67%
83%
98%
99%
100%
Denmark
22%
39%
91%
99%
100%
Bangladesh
38%
70%
92%
94%
100%
Lower sea levels: Ice Age coastlines and the ocean floor
Lower sea level to reveal the continental shelves and ocean floor. The Ice Age scenario applies a lower water level to today's terrain; it does not reconstruct past ice sheets or changes in land elevation.
−134 m: the last ice age
Between 29 and 21 thousand years ago the sea stood up to 134 m lower than today (Lambeck et al. 2014). That exposes 21.9 million km² (8.4 million square miles) of seabed, 6.1% of today's seas. Britain joins Europe across the floor of the North Sea, Asia joins America across the Bering Strait, and Australia joins New Guinea.
From −2000 m to the ocean floor
At −2,000 m, 57 million km² (22 million square miles) of seabed is exposed (15.8% of the seas) and water still covers 59.7% of Earth. At −4,000 m almost half the ocean floor is dry (46.6%). The last water disappears in the ocean trenches; the deepest point in this data is −10,769 m in the Mariana Trench.
How does the sea level map work, and what are its limits?
Water only where it can flow
For every place we calculate the lowest sea level at which water from today's sea reaches it. So the globe does not flood lowlands that higher ground cuts off from the sea: those are hatched, not blue. When the level falls, the globe shows the seabed as if the water were gone and leaves lakes as they are.
Simplifications
The water rises or falls by the same amount everywhere. In reality the sea rises unevenly, and in many places the land itself rises or sinks.
No dykes, pumps, tides or storms. 0 m is today's mean sea level.
The Greenland and Antarctic ice sheets are drawn as they look today.
Seas cut off by sills, such as the Mediterranean, would not really drop with the ocean.
Data
Land elevation and sea depth come from the GEBCO 2026 grid (public domain). For the figures we average it to 2′ (about 3.7 km), and the globe is drawn from an 8′ grid. The land part comes from satellite measurements that also record treetops and roofs, so we do not give areas for a few metres. Lakes, borders and coastline come from Natural Earth.
Natural Earth: Lakes, borders and coastline, public domain.
Questions about sea level rise and melting ice
How much would sea level rise if all the ice melted?
By about 66 m: the Greenland ice sheet holds 7.42 m, the Antarctic ice sheet 57.9 m and mountain glaciers 0.32 m (BedMachine 2017 and 2020, Farinotti et al. 2019). In our data the water would then cover 14.8 million km² (5.7 million square miles) of land, or 10%.
Can this map show sea level rise in 2050 or 2100?
The map lets you set a sea level change in metres, but it does not assign a date to that level. Projections for a given year depend on emissions and local conditions. On a whole globe a metre is smaller than a pixel, so this tool is for comparisons at a global scale. It does not assess flood risk for an individual city or property.
How much would the sea have to rise to cover half of the land?
By about 430 m. Water would then cover about 85% of Earth's surface instead of today's 70.9%. Flooding 90% of the land takes about +2,120 m. The ice sheets are counted as they are today.
At what sea level would Europe and Africa disappear?
Half of Europe would be under water at about +170 m, and 90% at about +720 m. Africa goes more slowly: half at about +500 m, 90% at about +1,250 m. The highest peaks would last longest: Kilimanjaro (5,895 m) in Africa, and in Europe Mont Blanc (about 4,800 m) or Elbrus (5,642 m), depending on where Europe's border is drawn.
At what sea level would Poland and the United States disappear?
Half of Poland would be under water at about +150 m, and 90% at about +290 m; Poland's highest peak, Rysy, is 2,499 m. Half of the United States goes under at about +450 m, 90% at about +1,840 m; its highest peak, Denali in Alaska, is 6,190 m. No dykes, on ground averaged to about 3.7 km.
How much water would it take to cover Mount Everest?
The sea would have to rise by 8,849 m, the height of Mount Everest (8,848.86 m in the 2020 survey by China and Nepal). By our data that takes about 4.4 billion km³ (1.05 billion cubic miles) of water, 3.3 times as much as all the oceans hold today (1.34 billion km³, 321 million cubic miles). All the water on Earth, including ice and groundwater, is about 1.39 billion km³ (333 million cubic miles, USGS), not even a third of it.
What would stay above water at +5,000 m?
Only 745,000 km² (288,000 square miles) of land, 0.5% of today's land, almost all of it on the Tibetan Plateau and in the Himalayas, with the rest in the Andes. The ground in this data is averaged to about 3.7 km, so the peaks come out lower than they are.
What would Poland look like if all the ice melted?
With a sea level rise of about 66 m, water would cover 8.9% of Poland's land in our data, with no dykes or pumps. For comparison, the Netherlands loses 98% of its land, Bangladesh 92%, Denmark 91% and the United Kingdom 28%. At +100 m Poland loses 24%, but there is not enough ice on Earth for that rise.
How does the world map change when sea level falls?
Continental shelves and the ocean floor emerge. At −134 m, close to the lowest level of the last ice age, 21.9 million km² (8.4 million square miles) of today's seabed is exposed: Britain joins Europe, Asia joins North America, and Australia joins New Guinea. At −2,000 m, 57 million km² (22 million square miles) of seabed is above water. This is an experiment on today's terrain, with lakes left unchanged.
At what level would the ocean reach the Caspian Sea?
In our data at about +32 m. The Caspian Sea is a lake whose surface lies below the level of the ocean. Once the sea passes the lowest sill on the way to it, the water also floods the lowland around the lake.
Why does +1 m barely change the globe?
On a whole globe a metre is smaller than a pixel, and global land elevation data also records treetops and roofs. A few metres need detailed maps of the coasts. The IPCC (2023) projects a rise of 0.28 to 1.01 m by 2100, depending on emissions.