Experiment

How low is the Netherlands? A sea level map from Amsterdam to Rotterdam

Move the slider from −10 to +10 m and see how far the sea would reach between Amsterdam and Rotterdam. Most of this area lies below sea level, protected by dunes, dykes and storm surge barriers.

Loading elevation data…
+1.0 mabove today
Raise
Lower
  • water
  • new water
  • below sea level, protected by dykes
  • exposed seabed
2.6 km²1 sq miof land under new water in the map area
2,709 km²1,050 sq milies below sea level but is held back by dunes, dykes and barriers

Half of the land within 500 m

When would the sea reach Rotterdam, Amsterdam and The Hague?

  • Zuidplaspoldertypical height of the area −5.9 m, water covers half of it from +6.1 mprotected
  • Schiphol Airporttypical height of the area −3.7 m, water covers half of it from +6.1 mprotected
  • Rotterdam city centretypical height of the area −0.1 m, water covers half of it from +6.1 mprotected
  • Gouda, Markttypical height of the area −0.2 m, water covers half of it from +6.1 mprotected
  • Amsterdam, Dam Squaretypical height of the area +1.1 m, water covers half of it from +6.1 mdry
  • The Hague, Binnenhoftypical height of the area +1.4 m, water covers half of it from +6.1 mdry

Data: Actueel Hoogtebestand Nederland (AHN4, Dutch elevation model), GEBCO 2026. Sources and changes

The Netherlands below sea level: how much land lies lower than the sea?

The west of the Netherlands, from Amsterdam to Rotterdam, is mostly polders that people have drained. The map shows it from AHN4, the Dutch elevation model measured by airborne laser scanning.

Below zero: 2,274 km² (880 square miles) in the map area

In this map area, which measures 80 by 60 km, 2,274 km² (880 square miles) of land lies below today's sea level, 70% of the land on the map. 968 km² (370 square miles) lies more than 2 m below sea level and 538 km² (210 square miles) more than 4 m below: these are mostly former lakes that were pumped dry, such as the Haarlemmermeer with Schiphol Airport.

Dutch heights are given relative to NAP (Normaal Amsterdams Peil). According to Rijkswaterstaat, 0 m NAP is roughly the mean level of the North Sea, and that is how the map treats it.

The lowest place in the whole country lies 6.76 m below NAP (Rijkswaterstaat), in the Zuidplaspolder between Gouda and Zevenhuizen (NOS). On our map the typical height of that area is about −5.9 m. For comparison, the lowest point of Poland lies 2.2 m below sea level, in the Vistula Delta (Statistics Poland).

At +1 m and at +5 m: what the dunes, dykes and barriers hold back

At +1 m the water covers only 2.6 km² (1 square miles), mostly land outside the dykes: riverbanks, beaches and quays. 2,709 km² (1,050 square miles) then lies below sea level but is held back by dunes, dykes and barriers. At +5 m 25.1 km² (10 square miles) is flooded and the dykes still hold back 3,079 km² (1,190 square miles).

Dunes shield the land from the sea, and storm surge barriers close off the rivers. The map closes them at the same levels as Rijkswaterstaat: the Hollandsche IJsselkering at +2.25 m NAP, the Maeslantkering and the Hartelkering at +3 m NAP at Rotterdam.

About +6 m: when the sea passes the outer ring

On our map the sea spills over the lowest dyke of the outer ring at about +6 m. Behind it almost all the ground lies lower, and the polders are linked by rivers and canals, so at that level the map shows almost everything under water: 3,136 km² (1,210 square miles) at +7.0 m. The map does not show time: in reality the water would pour in over hours or days, and the inner dykes could slow it down. The threshold itself is a result of our 10 m data, not the height of a particular dyke on the ground.

Why the Netherlands is not flooded today

Dunes, dykes and barriers protect the low ground, and pumps lift the water from the polders into canals that lie higher. The map assumes the dunes and dykes stay as they are today and do not break, and it does not count the work of the pumps.

How to read the sea level map of the Netherlands

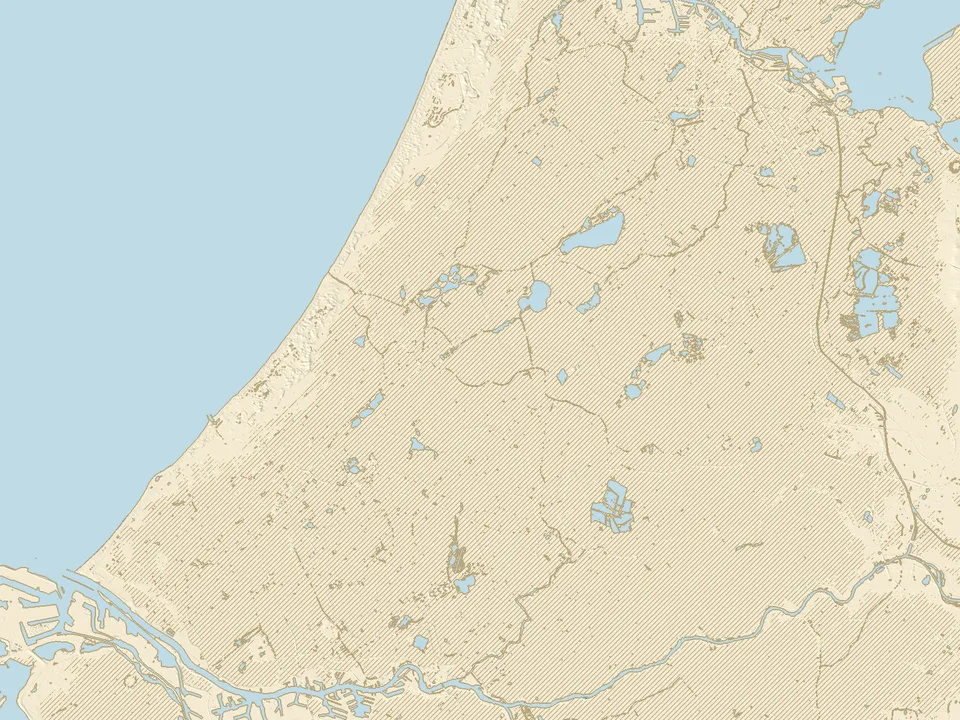
The colours on the map

  • Blue: new water. The sea reaches it at the chosen level if the dunes and dykes stay as they are today.
  • Hatched: the land lies below the chosen sea level, but the water does not reach it because dunes, dykes and barriers protect it.
  • Beige and grey: the seabed that is exposed when the sea draws back.
  • Light blue: the water that is there today: the North Sea, the Nieuwe Waterweg and the rivers, canals, lakes and the IJmeer.
  • Thin brown line: today's shore, which stays on the map at every level.

What this experiment shows, and what it does not

Assumptions

  • The level on the slider is the mean sea level, the same everywhere. The North Sea has marked tides and storms push the water higher still; the map shows the mean level only, without river floods or pumps.
  • The dunes and dykes keep today's height and do not break. When water spills over one, the ground behind it floods on the map at once.
  • The storm surge barriers stay open until sea level reaches the level at which Rijkswaterstaat closes them (+2.25 m NAP on the Hollandse IJssel, +3 m NAP at Rotterdam), and then stay shut. A shut barrier also cuts the rivers off from the sea; the map does not count that.
  • This is not a forecast for a given year and not a risk assessment for a particular house or plot.

The data and its accuracy

Land elevation comes from the Dutch AHN4 model (surveyed 2020 to 2022): ground without buildings or trees, measured by airborne laser scanning, here on a 10 m grid. The model leaves out locks, weirs and pumping stations, so we treat each one as a dyke as high as the dykes around it. Treat the flooding levels as approximate.

The sea floor comes from the GEBCO grid (cells of about 450 m), so at negative levels the shore is less accurate than on land.
Questions about the Netherlands and sea level

How much of the Netherlands is below sea level?

According to PBL (the Netherlands Environmental Assessment Agency, 2010), 26% of the Netherlands lies below sea level. In the area of our map, from Amsterdam to Rotterdam, 2,274 km² (880 square miles) of land lies below 0 m NAP, 70% of the land on the map.

Where is the lowest point in the Netherlands?

According to Rijkswaterstaat, the lowest part of the Netherlands lies 6.76 m below NAP. It is the Zuidplaspolder between Gouda and Zevenhuizen (NOS). On our map the typical height of that area is about −5.9 m, and the whole polder is hatched: it lies below sea level but dykes protect it.

How far below sea level is Amsterdam?

The centre around Dam Square is not below sea level: the typical height within 500 m is about +1.1 m. Much of the city and its surroundings lies lower, though, and the area around Schiphol Airport is typically about −3.7 m. The centre of Rotterdam is typically about −0.1 m.

Will the Netherlands be flooded?

It depends on how far the sea rises, and on the dykes. The IPCC (2023) projects a rise in mean sea level by 2100 of 0.28 to 1.01 m. On our map, at +1 m the water covers only 2.6 km² (1 square miles) of land outside the dykes, and the dunes, dykes and barriers hold out to about +6 m. The map counts mean sea level, without storms or tides, so this is not a risk assessment for a particular place.

When will the Netherlands be under water?

We do not give a date: the map shows sea levels in metres, not years. The timing depends on how fast sea level rises, on how the Netherlands raises its dykes, and on storms. On our map Rotterdam, Amsterdam, The Hague and Gouda flood only once the sea passes the outer ring, at about +6 m.

Why is the Netherlands not flooded if it lies below sea level?

Dunes, dykes and storm surge barriers protect it, and pumps drain the water from the polders. On the map it shows as hatched ground: at 0 m, 2,274 km² (880 square miles) lies below sea level and there is no new water.

Where does the data on this map come from?

Land elevation comes from the Dutch elevation model Actueel Hoogtebestand Nederland (AHN4) from the PDOK service, released without restrictions, and the sea floor from the GEBCO 2026 grid. Our own calculation shows which places the water reaches over today's dunes, dykes and barriers. The data methodology page describes the sources and our changes.