Experiment

Gdańsk and the Vistula Delta (Żuławy): how far would the sea reach?

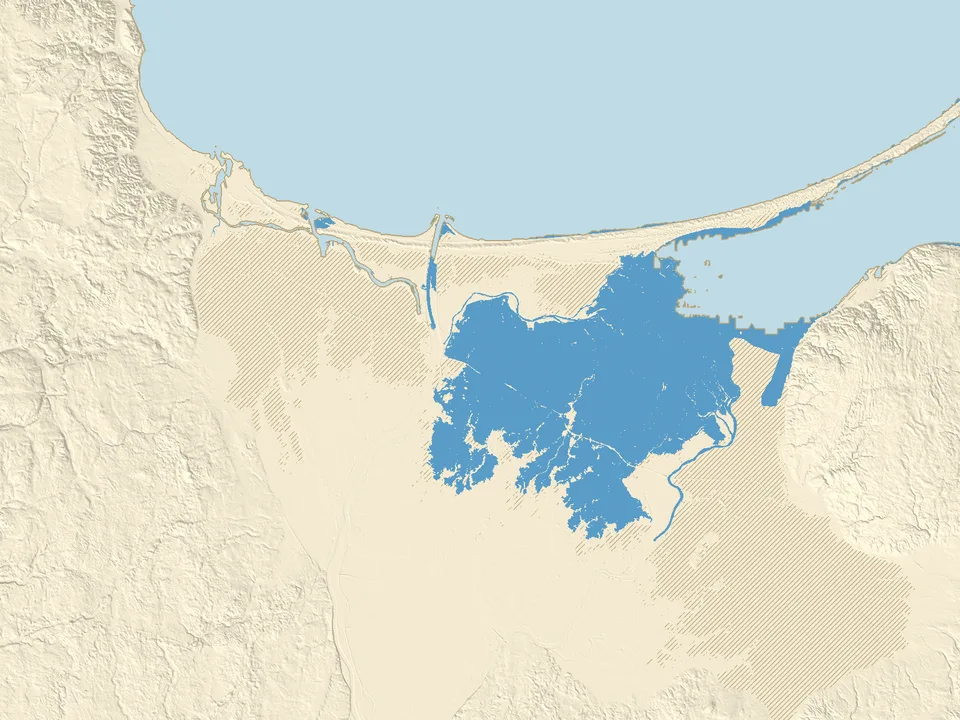
Move the slider from −10 to +10 m and see how far the sea would reach around Gdańsk. Żuławy, the Vistula Delta, has large areas below sea level that dykes and pumps protect.
Loading elevation data…
+1.0 mabove today
Raise
Lower
  • water
  • new water
  • below sea level, protected by dykes
  • exposed seabed
381 km²150 sq miof land under new water in the map area
580 km²220 sq milies below sea level but is held back by dykes

Half of the land within 500 m

When would the sea reach Gdańsk, Elbląg and Nowy Dwór Gdański?

  • Raczki Elbląskietypical height of the area −1.6 m, water covers half of it from +1.1 mprotected
  • Marzęcinotypical height of the area −0.5 m, water covers half of it from +0.7 mflooded
  • Nowy Dwór Gdańskitypical height of the area +1.2 m, water covers half of it from +1.4 mdry
  • Gdańsk Stogitypical height of the area +3.0 m, water covers half of it from +3.7 mdry
  • Elblągtypical height of the area +4.5 m, water covers half of it from +4.7 mdry
  • Gdańsk Main Towntypical height of the area +4.6 m, water covers half of it from +4.7 mdry

Data: Polish Head Office of Geodesy and Cartography (GUGiK, terrain model), GEBCO 2026. Sources and changes

The Vistula Delta (Żuławy): how much land lies below sea level?

The delta of the Vistula is the lowest part of Poland. The map shows it from the 10 m elevation data of GUGiK, the Polish geodesy office.

Below zero: 596 km² (230 square miles) in the map area

In this map area, which measures 80 by 60 km, 596 km² (230 square miles) of land lies below today's sea level. According to Statistics Poland (Mały Rocznik Statystyczny Polski 2022), the lowest point is the village of Marzęcino in the Nowy Dwór Gdański municipality, 2.2 m below sea level. Raczki Elbląskie, 1.8 m below, used to hold that title.

On our map both places lie on hatched ground: water covers half of the area around Marzęcino at about +0.7 m and around Raczki Elbląskie at about +1.1 m.

At +1 m and at +2 m: what the dykes hold back

At +1 m the water covers 381 km² (150 square miles), and 580 km² (220 square miles) lies below sea level but is held back by dykes. At +2 m 1,103 km² (430 square miles) is flooded and only 86.7 km² (33 square miles) stays out of the water's reach.

The first clear flooding starts at about +0.5 m (43.2 km² (17 square miles)). Higher up, the water spills over the dykes and onto the next polders.

Why the delta is not flooded today

Today dykes protect the low ground and pumps drain the excess water. Without them the water of the Vistula, the Nogat and the sea would pour onto the polders. The map assumes the dykes stay as they are today and do not break, and it does not count the work of the pumps.

How to read the sea level map of Gdańsk and the Vistula Delta

The colours on the map

  • Blue: new water. The sea reaches it at the chosen level if the dykes stay as they are today.
  • Hatched: the land lies below the chosen sea level, but the water does not reach it because dykes protect it.
  • Beige and grey: the seabed that is exposed when the sea draws back.
  • Light blue: the water that is there today: the Gulf of Gdańsk, the Vistula and its branches, canals and part of the Vistula Lagoon.
  • Thin brown line: today's shore, which stays on the map at every level.

What this experiment shows, and what it does not

Assumptions

  • The level on the slider is the mean sea level, the same everywhere. There are no tides, storms, river floods or pumps.
  • The dykes keep today's height and do not break. When water spills over one, the ground behind it floods on the map at once.
  • This is not a forecast for a given year and not a risk assessment for a particular house or plot.

The data and its accuracy

Land elevation comes from the GUGiK terrain model: ground without buildings or trees, measured by airborne laser scanning, here on a 10 m grid. A narrow dyke is simplified on such a grid, so treat the flooding levels as approximate.

The sea floor comes from the GEBCO grid (cells of about 450 m), so at negative levels the shore is less accurate than on land. The map ends at the edge of the Polish data, so the eastern part of the Vistula Lagoon is not shown.

Questions about the Vistula Delta and sea level

Which places in Żuławy lie below sea level?

According to GUGiK data, 596 km² (230 square miles) of this map area lies below 0 m. It is mainly the polders around Nowy Dwór Gdański and Elbląg and the lowlands near Gdańsk, which dykes and pumps protect today. They are hatched on the map.

Where is the lowest point in Poland?

According to Statistics Poland (Mały Rocznik Statystyczny Polski 2022) the lowest point is the village of Marzęcino in the Nowy Dwór Gdański municipality: 2.2 m below sea level. Raczki Elbląskie, 1.8 m below, held that title before. Both places are in the Vistula Delta, on the hatched ground of our map.

At what sea level would the water reach Nowy Dwór Gdański, Elbląg and Gdańsk?

At about +1.4 m water covers half of the area around Nowy Dwór Gdański (within 500 m of the centre), at about +3.7 m around Stogi in Gdańsk, and at about +4.7 m around Elbląg and Gdańsk's Main Town. We assume the dykes stay as they are today.

Will Gdańsk be flooded?

It depends on how far the sea rises, and on the dykes. On our map flooding starts in the Vistula Delta: at +1 m the water covers 381 km² (150 square miles). The city itself lies higher: water covers half of the area around Sobieszewo at about +2.4 m, around Stogi at about +3.7 m and around the Main Town at about +4.7 m. All of these levels are higher than the IPCC projections to 2100 (0.28 to 1.01 m). The map counts mean sea level, without storms, which raise the water for a short time, so this is not a risk assessment for a particular place.

When will Gdańsk be flooded?

We do not give a date: the map shows sea levels in metres, not years. The timing depends on how fast sea level rises, on the dykes and on storms. The IPCC (2023) projects a rise in mean sea level by 2100 of 0.28 to 1.01 m, measured from the 1995 to 2014 average, and locally the rise can differ. On our map the first clear flooding of the Vistula Delta starts at about +0.5 m (43.2 km² (17 square miles)), and Gdańsk's Main Town at about +4.7 m.

Will Gdańsk be under water in 2050 or 2100?

The map does not assign years to sea levels. The upper end of the IPCC (2023) projections to 2100 is about +1 m: at that level the water covers 381 km² (150 square miles) of the Vistula Delta on our map, but Gdańsk's Main Town lies higher and floods only at about +4.7 m. We give no figures for 2050: the rise by 2050 will be smaller than by 2100. Storms, tides, pumps and the future height of the dykes can change this, and we do not count them here.

Why is the Vistula Delta not flooded if it lies below sea level?

Dykes and pumps protect it. On the map it shows as hatched ground: at 0 m, 596 km² (230 square miles) lies below sea level and there is no new water. The first clear flooding starts at about +0.5 m (43.2 km² (17 square miles)), and at +1 m the water already covers 381 km² (150 square miles).

Where does the data on this map come from?

Land elevation comes from the terrain model of the Polish Head Office of Geodesy and Cartography (GUGiK, 10 m grid) and the sea floor from the GEBCO 2026 grid. Our own calculation shows which places the water reaches over today's dykes. The data methodology page describes the sources and our changes.