
Finland: true size, area and map scale
Finland ranks 66 out of 200 by area (336,884 km²) and 116 out of 197 by population in this dataset. Its outline is shown at true scale and under different map projections.
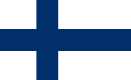
Finland covers 336,884 km² and has a population of approximately 5,646,436 people, averaging 18.6/km². The closest area match in the dataset is the Republic of the Congo.
Finland: true size, population, and map scale without illusions
Finland covers 336,884 km², ranking 66 out of 200 by area in this dataset. This is a mid-to-large area, useful for comparisons with countries familiar from European maps. Within Europe, that places it 7 out of 44.
Finland is about 1.1 times larger than Poland by area. This comparison is deliberately simple: Poland works as an easy reference point, and then it makes sense to move toward a similarly sized country. By area, the closest match is the Republic of the Congo.
The population is approximately 5,646,436 people, with an average density of 18.6/km². Finland ranks 116 out of 197 by population and 172 out of 197 by density. That points to a fairly spread-out population profile, where cities and open spaces strongly contrast.
Within its continent, Finland represents about 5.4% of the area and about 0.94% of the population covered by this dataset. Its continental population rank is 22 out of 43, so area alone does not tell the full story.
Europe is familiar from school maps, yet its northern position means comparisons with countries nearer the equator can still be surprising. That is why Finland is best read through several lenses: raw numbers, an equal-scale outline, a comparison with Poland, and a matchup with the Republic of the Congo. Then the map stops being a picture and starts becoming a tool for discovery.
If you want to remember the scale quickly, compare Finland with a country of similar area and a country of similar population. By population, Norway is a useful next clue.
How to explore Finland on the map
The best path is short: compare outlines, check a country with similar population, then try the quiz. It turns numbers into something easier to remember.
The numeric values are used as comparative references for learning scale. Rankings include only countries and territories with a verified value in the selected sources.
Can you judge the population density of Finland?
Move from this country profile into a quick test powered by the same data.
One attempt, the same set for everyone
Size illusion · Build a streak and come back tomorrow for another map.
✦ Suggested 1vs1 Comparisons
Analyze interactive silhouette overlays and cartographic distortions for related pairs:


Finland vs Poland
Direct comparison against Poland as a common baseline.
View 1vs1 comparison →
Finland vs Vietnam
Vietnam covers 331,345 km² (nearly identical scale).
View 1vs1 comparison →
Finland vs Brazil
Comparison with a country from a different latitude to highlight map stretching.
View 1vs1 comparison →Size comparisons with Finland
Frequently asked questions about size and location
Finland covers 336,884 km². In this dataset, that ranks 66 out of 200 by area, and 7 out of 44 within its continent. Finland is about 1.1 times larger than Poland by area.
The population is approximately 5,646,436 people, with an average density of 18.6/km². Finland ranks 116 out of 197 by population and 172 out of 197 by density. That points to a fairly spread-out population profile, where cities and open spaces strongly contrast.
Two comparisons work especially well: Finland vs Poland as a familiar reference point, and Finland vs Republic of the Congo because their areas are very close. For population, Norway is another useful comparison.
Europe is familiar from school maps, yet its northern position means comparisons with countries nearer the equator can still be surprising. That is why a country's position on the map can mislead, while same-scale outline comparison usually gives a better intuition than a classic atlas.
Every projection moves a globe onto a flat surface and must trade something away: shape, area, direction, or distance. On this page, you can compare the impression created by Mercator, orthographic, and equal-area views.
Start with the numbers, open a 1vs1 comparison with a similar country, and then try the size-illusion quiz. That sequence combines facts, visuals, and play, making the scale easier to remember.